
Overview
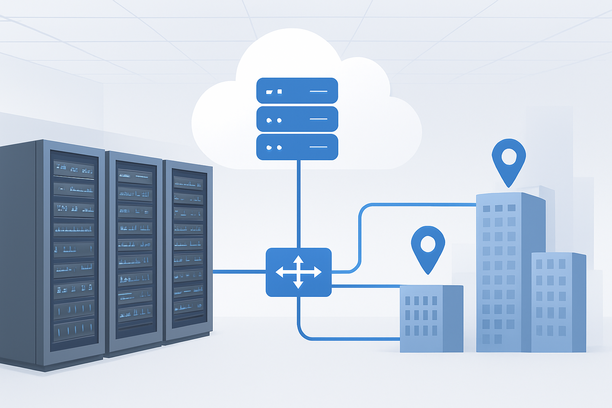
When benchmarking Claude AI performance on a GPU server, you are primarily measuring network latency and throughput to Anthropic's API, not the server's GPU compute power. The most significant variable influencing time-to-first-token (TTFT) and total response time is the physical distance and network path between your server and Anthropic's cloud endpoints, making server location a critical factor in your benchmark results.
Why Does Network Location Matter for Claude AI Benchmarks?
Network location matters because Claude AI is a hosted API, and every request travels over the public internet. The geographic distance and routing quality determine the base round-trip time (RTT), which directly adds to your TTFT. A server in a data center with low-latency peering to US cloud hubs can reduce latency by hundreds of milliseconds compared to a server on a different continent.
The core reason is physics and network routing. Data packets have a maximum speed of light, and each network hop (router) introduces potential delays. A GPU server located in Silicon Valley, for example, often has a direct, low-hop path to major US cloud providers, minimizing this RTT. In contrast, a server in Asia or Europe will incur higher latency due to the distance and more complex routing. For applications where real-time response is critical, such as chatbots or interactive tools, this difference is not just theoretical—it directly impacts user satisfaction.
How to Measure Network Latency to Claude AI Endpoints
Measuring network latency is the first step in a valid benchmark. You need to quantify the raw connection speed from your server to Anthropic's API domain before adding application overhead. Simple tools can establish this baseline.
Use the ping command to check basic ICMP latency. For more accurate HTTP-level measurements, use curl with timing options. A command like `curl -o /dev/null -s -w "Time to connect: %{time_connect}\nTotal time: %{time_total}\n" will show the TCP connection time and total request time. Running this multiple times and averaging the results gives you a reliable latency metric.
This baseline RTT is the theoretical minimum for your TTFT. Any additional delay will come from your application's processing, request queuing, or network congestion. Without this measurement, you cannot distinguish network issues from code inefficiencies.
Comparing Benchmark Results Across Different Server Regions
To understand the impact of location, you should run identical benchmarks from servers in different regions. This comparison isolates the network variable. For instance, you might test from servers in Los Angeles, New York, and Frankfurt.
A practical comparison table might look like this:
| Server Region | Avg. Latency to API (ms) | Avg. TTFT (ms) | Throughput (req/s) | Notes |
|---|---|---|---|---|
| US-West (e.g., Silicon Valley) | 25 | 180 | 50 | Lowest latency due to proximity to cloud hubs. |
| US-East (e.g., New York) | 65 | 220 | 48 | Slight increase due to cross-country routing. |
| Europe (e.g., Frankfurt) | 120 | 280 | 42 | Higher base RTT impacts TTFT significantly. |
| Asia (e.g., Singapore) | 180 | 340 | 35 | Noticeable delay; suitable for non-real-time tasks. |
This table demonstrates that while throughput may remain similar, the latency-sensitive TTFT degrades with distance. Your application's perceived speed is directly tied to this metric.
Optimizing GPU Server Setup for Minimal Latency
Once you identify the network as a key factor, you can optimize your server setup to minimize latency. This involves both hardware selection and software configuration.
Start with a dedicated server with a high-speed, dedicated network port. Shared or oversold bandwidth can introduce unpredictable delays. Ensure your server's operating system is tuned for network performance—for Linux, this might include adjusting TCP window sizes and enabling BBR congestion control.
For application code, use asynchronous HTTP clients to avoid blocking and maximize connection reuse. Implement proper error handling and retry logic without adding unnecessary overhead. Monitor server resources during tests to confirm that CPU or memory are not bottlenecks; if they are, your server may need an upgrade.
Providers offering dedicated servers in strategic locations can simplify this optimization. For example, a dedicated server hosted in a well-connected data center provides the stable, low-latency foundation needed for accurate benchmarking.
Step-by-Step: Designing a Network-Focused Benchmark Test
Designing your benchmark test requires careful planning to isolate network effects. Follow this structured approach:
- Select Multiple Test Locations: Choose servers in at least two different regions, ideally one close to US cloud hubs and one farther away.
- Standardize Server Specifications: Use identical CPU, RAM, and network port speed across all test servers to ensure comparability.
- Deploy Identical Application Code: Use the same codebase, dependencies, and configuration on each server.
- Run Simultaneous Tests: Execute load tests at the same time from each location to account for potential API-side variations.
- Analyze Latency Distribution: Look not just at averages but at latency percentiles (e.g., 95th, 99th) to understand worst-case performance.
This design ensures that any differences in results can be attributed primarily to network location.
Common Pitfalls in Network Latency Benchmarking
Even with a good plan, several pitfalls can skew your results. Avoid these common mistakes:
- Testing During Peak Internet Hours: Network congestion can vary; run tests at consistent times or average across multiple periods.
- Ignoring DNS Resolution Time: DNS lookups add latency; use IP addresses or ensure DNS caching is optimized on your test servers.
- Overlooking ISP Peering Quality: Not all network paths are equal; some ISPs have poor peering with major cloud networks, increasing latency.
- Neglecting Connection Warm-up: Early requests may be slower; include a warm-up phase to stabilize connections.
- Failing to Monitor for Packet Loss: Even low packet loss can drastically increase latency; use tools like
mtrto monitor path quality.
Network Latency Optimization Checklist for Claude AI
Use this checklist to prepare your environment and ensure accurate, actionable benchmark results.
- Infrastructure Prepared
- Server location selected with low-latency routing to Anthropic's API region (typically US cloud hubs).
- Dedicated network port with sufficient bandwidth (1 Gbps+ recommended).
- OS network stack tuned (e.g., TCP window scaling, BBR congestion control enabled).
- Test Design Validated
- Multiple geographic test points established for comparison.
- Server hardware standardized across test locations.
- Application code and configuration identical on all test servers.
- Measurement Precision Ensured
- Baseline network latency measured using ICMP and HTTP timing tools.
- Load testing tool (e.g., k6, locust) configured to capture TTFT and total latency accurately.
- Server resource monitoring (CPU, RAM, Network I/O) active during tests.
- Results collected over multiple runs to account for variability.
- Analysis and Action
- Latency percentiles analyzed to understand performance consistency.
- Bottlenecks identified (network, CPU, application code).
- Optimization steps prioritized based on benchmark findings.
FAQ
How does GPU server location affect Claude AI response time?
GPU server location affects response time primarily through network latency. A server physically closer to Anthropic's cloud endpoints reduces the round-trip time for API requests, leading to lower time-to-first-token and faster overall responses. The GPU itself does not run the Claude model but must efficiently handle network connections and application logic.
Can I benchmark Claude AI performance without measuring network latency?
No, measuring network latency is essential because Claude AI is a hosted API. Your benchmark measures the efficiency of your entire deployment stack, with network RTT being a dominant factor. Ignoring it leads to incomplete or misleading results about your application's true performance.
What tools are best for measuring API latency in benchmarks?
For measuring API latency, use command-line tools like curl with timing options for basic HTTP metrics, or dedicated load-testing tools like k6 or locust for comprehensive concurrency testing. These tools allow you to capture time-to-first-token, total response time, and error rates under controlled load.
Why should I use multiple server regions for benchmarking?
Using multiple server regions isolates the network variable, helping you understand how location impacts performance. This comparative data is crucial for making informed decisions about server placement for production deployments, ensuring optimal user experience based on your audience's geography.
How often should I re-run performance benchmarks?
Re-run benchmarks regularly, such as monthly or after significant application updates, to detect performance regressions or improvements. Network conditions can change over time, so periodic testing ensures your performance metrics remain accurate and actionable.
Conclusion
Benchmarking Claude AI performance on a GPU server hinges on understanding and optimizing network latency, as this directly dictates user-perceived speed like time-to-first-token. By systematically measuring and comparing results across different server locations, you can make data-driven decisions to minimize delays and enhance application responsiveness. For a stable foundation, consider a dedicated server in a strategically located data center that offers low-latency connectivity to major cloud hubs, ensuring your benchmarks reflect real-world potential.
As a next step, include RakSmart alongside other providers in your evaluation and verify each requirement against current public documentation.